Price Action Reversal Theory
In this, we'd learn what PART is, and how to trade with PART.
Remeber Price Action ? Yes, the same old candle shapes. Let's see how and why sometimes they just work opposite to how they're supposed to work.
We are going to see Hammers, Dojis, and candles that are a mix of these both in this post. So, let's jump right in.
Spinning Tops - These are Candles whose wicks resemble a doji, and body of a hammer. (These are dojis with small bodies) A typical spinning top looks like this:
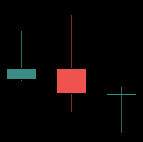
So what about these ? Well, these are candles which show traders are mildly certian of the price moves, but largely confused. These also have bullish/bearish types, and just like all single price patterns, color is irrelevant, and shape matters.
Now, for the PART...
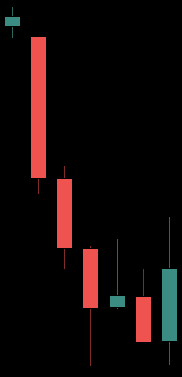
A bullish single candle price action pattern causes a fall in an uptrend, and a bearish single candle price aciton pattern causes a rise in a downtrend.
WHY? The reasoning is pretty straightforward. Look at the chart below.
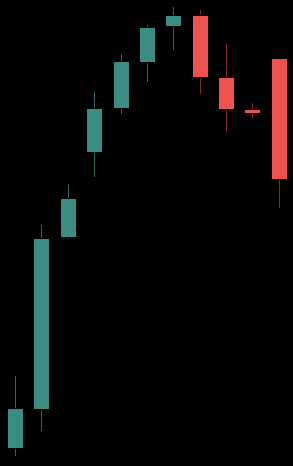
The reason lies in the definition of a hammer. A hammer is when a low is made, and is recovered from right? So, take the case of the buyers during the up run prior to the hammer. Some'd get afraid when the candle makes a low lower than the mid point of the previous candle (see the image above), and exit, causing a market fall.
Now, this fall would be definitely until the low of the hammer. That is a certianity. That typically happens in a matter of 1-3 candles. Further move is decided by the support/resistance levels.
PART notably works quickly in timeframes lesser than 1 Day, and works, but, slowly in the Daily tf, making the Risk-Reward unfavourable on Daily tf.
